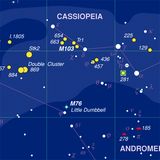
Even though Starry NightŪ offers a great system for generating lists of objects to observe, I've personally always found a graphical presentation more useful.
I've never really cared for the 180° all sky charts which you see in most books and magazines, and which Starry NightŪ generates automatically. I find the scale too small and the constellations appear distorted. I prefer to generate a set of four larger scale charts, each depicting a quarter of the sky, centred on the four points of the compass and each showing the sky from horizon to zenith.
Let's suppose I want to observe objects from Messier's catalog around 10 p.m. on New Moon night, August 12, from my farm in Coldwater, Ontario. I start by setting Starry NightŪ to this time and date. On the Options pane, I add the things I want on my chart: the constellation stick figures and boundaries, and the Messier objects. Since I?ll be observing with a Dobsonian, I also turn on the Alt-Az Grid.
The major trick I've discovered is how to generate a chart which includes exactly 90° from left to right and also from horizon to zenith. Here's how to do it.
First open the pane on the left side of the screen; it doesn't matter which tab you click. Between the pane and the tabs is a very narrow vertical blue strip with a single short vertical line in its middle. This is the handle which lets you adjust the width of the pane, but it also allows you to adjust the dimensions of the viewing window.
Put your mouse on this narrow strip and experiment with dragging it to the left and right.
As you do so, observe what happens in the Zoom window at the far right end of the tool bar. Strangely enough, the "width" dimension stays the same (100° is the default) while the "height" dimension changes. Adjust it until the two numbers are the same (100° say) and leave the blue strip there.
Now click on the arrow on the right side of the Zoom box and select 90° from close to the bottom of the menu. Drag the sky image downwards with the mouse until the two tiny arrows forming a circle appear at the top of the screen. Back up a tiny bit until they just disappear. Your window is now set to display 90° of the sky from east to west, and 90° from horizon to zenith.
To get four exact quadrants of the sky facing North, West, South, and East, turn on the scroll bars under the View menu. If you slide the scroll slider all the way to the right of the scroll bar, you will be viewing North. Print this chart with the following settings N.pdf:
- 1 Pane ON
- "Full Sky" Chart (180°) OFF
- Fill page when printing OFF
- Use current settings ON
- Print legend ON
Now click once in the scroll bar to the left of the slider. The chart will now be centred on the Western sky. Print this chart W.pdf. Click again to the left of the slider, and you'll get the Southern view. Print S.pdf. A final click will move the view to the East. Print the final chart E.pdf.
I find charts in this format extremely easy to use in planning my observations. I concentrate first on the objects towards the bottom of the South chart, because these are low in the sky and will never get any higher. Then I look for objects low on the West chart because they too will be setting soon. I can be more relaxed looking for objects on the East chart, and leave those on the North chart for last, because they are mostly circumpolar.
I avoid objects right at the tops of the charts because these are in "Dobson's Hole," the part of the sky hard to reach with a Dobsonian mounted telescope. In an hour or two, these objects will have moved to a more comfortable position.
I use charts like these for all my observations, for example plotting all of the variable stars currently on my observing program. I can prioritize my observations in seconds, and easily see which objects will be conveniently close to each other for observing.
When I was observing the Herschel 400 deep sky objects, I put together a customized Starry NightŪ observing list of the objects I had yet to observe, and then removed the ones I'd observed each morning after I finished an observing session.
It gave me a sense of accomplishment to see the plotted objects gradually disappear until all were gone, and I'd completed the list!
August 2007
Geoff has been a life-long telescope addict, and is active in many areas of visual observation; he is a moderator of the Yahoo "Talking Telescopes" group.


